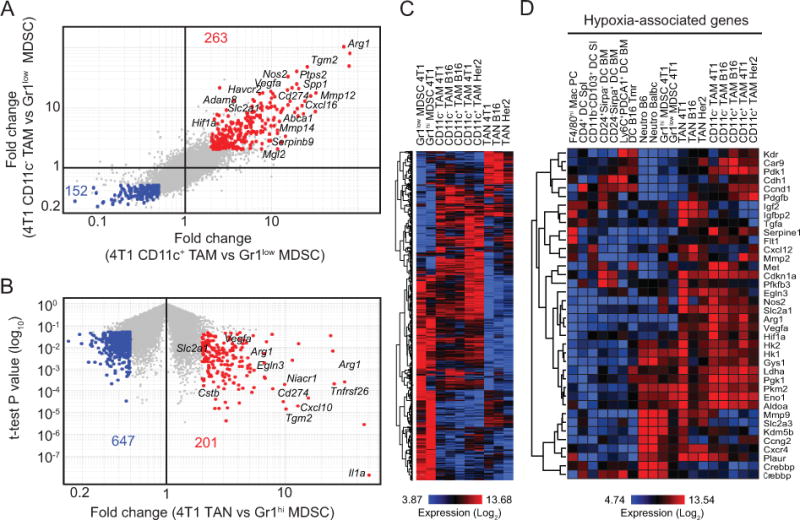
Figure 4. Tumor-infiltrating myeloid cells express immunomodulatory genes.

A, Comparison of gene expression profiles of CD11c+ and CD11c− TAMs to Gr1low MDSCs from 4T1 tumor-bearing mice based on 2-fold change (fold-change vs fold-change plot). B, Comparison of gene expression profiles of TANs and Gr1hi MDSCs from 4T1 tumor-bearing mice (fold-change vs t-test P value plot). C, Heatmap generated by hierarchical clustering using probes identified in A and B for all tumor myeloid subsets. D, Heatmap showing the expression of hypoxia-related genes by tumor-associated and steady-state myeloid cells. Selected genes associated with the populations are indicated on the plots.
