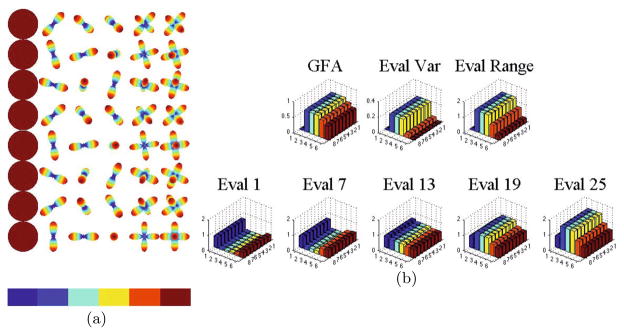
Fig. 2.

Synthetic ODF field of 0-, 1-, 2-, and 3-fiber ODFs with various rotations and no noise. The graphs in 2(b) are colorcoded by the color bar in 2(a) to indicate each column of the ODF field while each row is a different rotation of each ODF. The constant height of each color in the bar graphs indicate the invariance of the eigenvalues under rotation and the relative differences in values for ODFs with varying number of crossing fibers.
