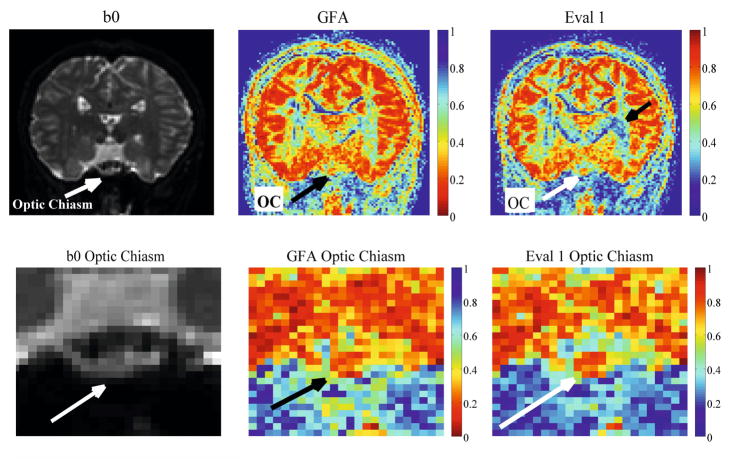
Fig. 5.
Real HARDI scalar maps of the optic chiasm fiber crossing. The bottom arrows identify the location of the optic chiasm. We can distinguish the chiasm in the Eval 1 map while the GFA is noiser. The top arrow in the whole brain Eval 1 map indicates a region where there is more detail to highly anisotropic fiber tracts than the GFA.

