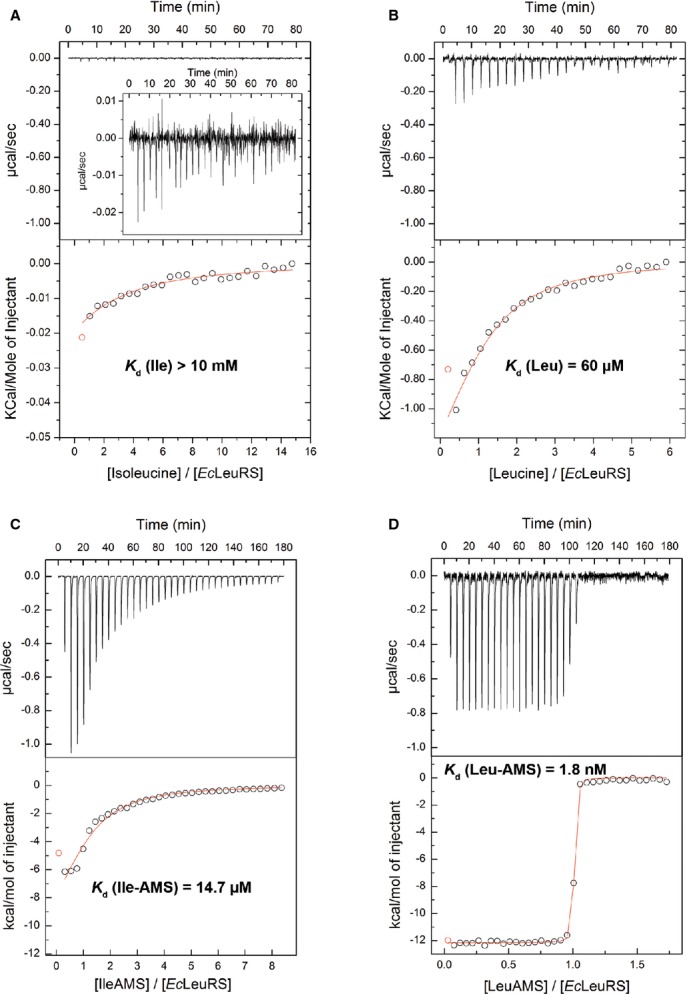
Figure 5. Isothermal titration calorimetry experiments showing the binding of cognate and non-cognate amino acids or AA-AMP analogues to E. coli LeuRS.

A–D EcLeuRS at 70 μM in the sample cell titrated by (A) isoleucine at 10 mM and (B) leucine at 2 mM, and titration of EcLeuRS at 20–25 μM by (C) Ile-AMS at 0.6 mM and (D) Leu-AMS at 0.3 mM. The upper graphs show the raw data (in same scale to show the affinity differences), and the bottom graphs show the ligand concentration dependence of the heat released upon binding after normalization. Kd values represent the average from at least two independent experiments (the associated errors are about 5%). Inset panel show amplification of the binding profile.
