
Figure 7. AMP and Ile-tRNALeu production in parallel reaction assays.
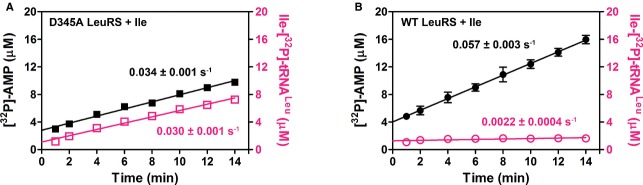
A, B Time-courses following AMP production are illustrated with filled symbols, while time-courses following Ile-tRNALeu production are illustrated with empty magenta-colored symbols. (A) 250 nM D345A LeuRS. (B) 250 nM WT LeuRS. Because of the low Ile-tRNALeu accumulation by WT LeuRS, the formation rate of 0.0022 s−1 (B) should be taken as an approximate value. The rate constants represent the best fit value ± s.e.m. of three independent experiments.