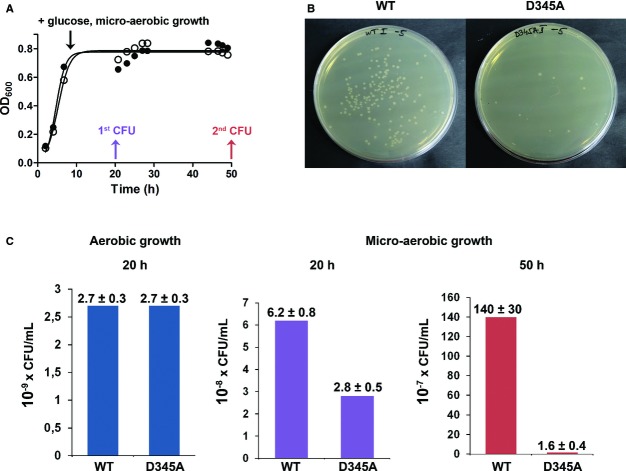
Figure 9. Cell viability under micro-aerobic conditions.
- Growth curves of LeuRS WT (•) or editing-deficient (D345A LeuRS) (○) E. coli strains. The black arrow indicates the start of the glucose feed and promotion of the micro-aerobic conditions by reduced agitation. The purple and red arrows indicate the time-points when the cultures were sampled for the CFU assay.
- Representative plate dilutions of both WT and D345A strains from the CFU assay performed after 50 h of growth under micro-aerobic conditions.
- Cell viability of WT and D345A strains grown in aerobic conditions (blue column chart, 20 h of growth) and micro-aerobic conditions (purple column chart, 20 h of growth, red column chart, 50 h of growth). Note that labels of the y-axis for each of the column charts are in different orders of magnitude. Errors correspond to the s.e.m. from four independent experiments.

