
Figure 3. Mature secretory vesicles are devoid of vti1a staining.
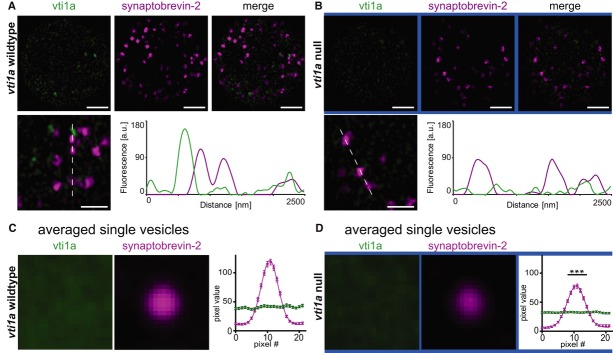
A, B 3D-SIM optical sections obtained near the footprint of a WT cell (A) and a vti1a null cell (B) stained for vti1a (green) and syb-2/VAMP2 (magenta). Syb-2-positive granules appear to be largely devoid of vti1a, as shown by the line profile (A, bottom panels). In 3D-SIM, the homogeneous background staining in the null appears as ‘speckles’ (B, bottom panel).
C To investigate whether vti1a is enriched on LDCVs, individual vesicles were aligned by their syb-2 fluorescence in subimages (22 × 22 pixel, pixel size: 40 nm) and averaged. The syb-2 staining (middle panel) was highly enriched on the vesicle, while the averaged vti1a staining (left panel) was homogenous, showing that there is no enrichment of vti1a on the vesicle. The right panel shows the pixel intensity distribution through the mid-section of the vesicle. The line is a fit of a Gaussian to the syb-2 signal.
D Single-vesicle fluorescence analysis in the vti1a null. The peak fluorescence values for syb-2 are significantly reduced compared to the WT (C). The line shows the best fit of a Gaussian.
Data information: Data are means, and error bars represent SEM. Number of cells (n) and vesicles (N) that were analyzed in (C) and (D): wild-type: n = 3, N = 76; vti1a null: n = 3, N = 63. ***P < 0.001. Scale bar, 2 μm.