
Figure 5. Loss of vti1a results in a decreased number of releasable (primed) vesicles.
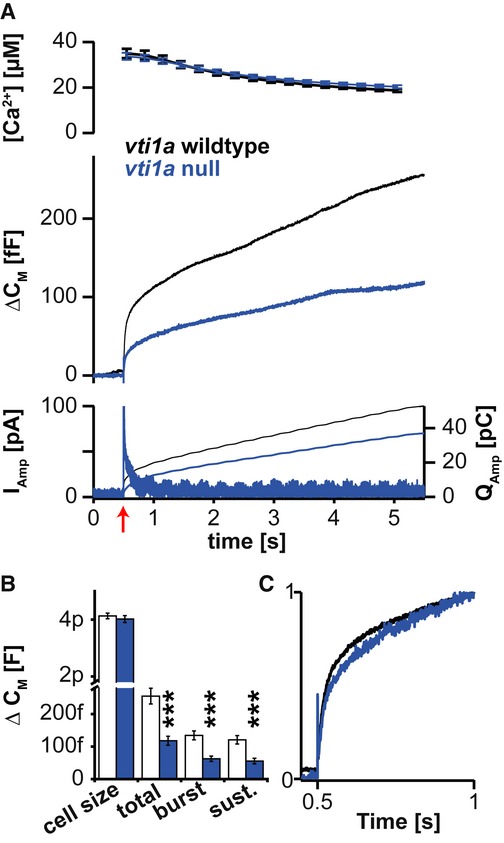
- Exocytosis induced by Ca2+-uncaging is reduced in vti1a nulls. Ca2+-uncaging at 0.5 s (at red arrow) led to a rapid increase in the global Ca2+-concentration (top) which resulted in vesicle fusion leading to an increase in cellular capacitance (middle), amperometric current (bottom, left ordinate), and cumulative charge (bottom, right ordinate).
- Quantification of the cellular capacitance prior to uncaging (cell size) and changes in capacitance at 1 s (burst) and 5 s (total) after uncaging. The sustained release (sust.) is the difference between total and burst secretion.
- Release kinetics is unaltered in vti1a nulls: capacitance curves from the middle panel of (A) scaled to their respective values at 1 s have similar shapes.
Data information: Bar diagram shows means ± SEM. Number of cells (n): wild-type: n = 34; vti1a null: n = 30. ***P < 0.001.