
Figure 7. Optical control of cell behaviour.
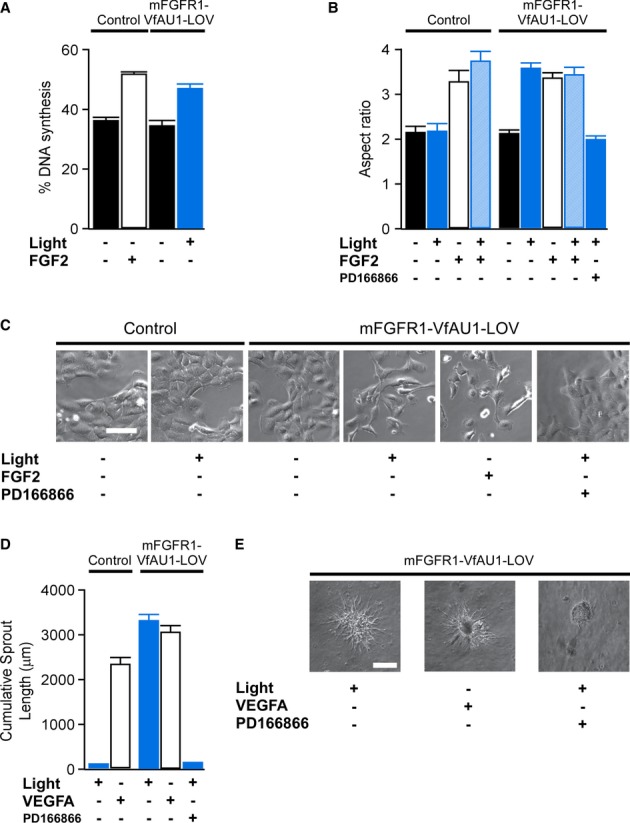
- Percentage of DNA synthesis in control and M38KOpto-mFGFR1 cells in response to blue light or FGF2 ligand. Cells were stimulated with blue light for 1 h. Proliferation was analysed after 26 h. Mean values ± SEM for 15–20 micrographs with 50–300 cells per micrograph from two independent experiments are shown.
- Morphology changes in control and M38KOpto-mFGFR1 cells in response to blue light or FGF2 ligand. Cells were stimulated with blue light for 1 h. Morphology was analysed after 24 h. Mean values ± SEM for 60 individual cells from two independent experiments are shown.
- Representative images for (B). Scale bar: 40 μm.
- Sprouting in control and hBEOpto-mFGFR1 cells in response to blue light or VEGFA ligand. Cells were stimulated with blue light for 5 min every 10 min during 10 h followed by analysis or morphology. Mean values ± SEM for 8–11 spheres per group in three independent experiments are shown.
- Representative images for (D). Scale bar: 100 μm.
Data information: Control cells were infected with mCherry. P < 0.05 for stimulated versus unstimulated cells (One-way ANOVA with Tukey's post-hoc test); n.s. for light stimulation versus FGF2/VEGFA stimulation; n.s. for unstimulated control cells versus unstimulated Opto-mFGFR1 cells. Light intensity was ˜2.5 μW/mm2.