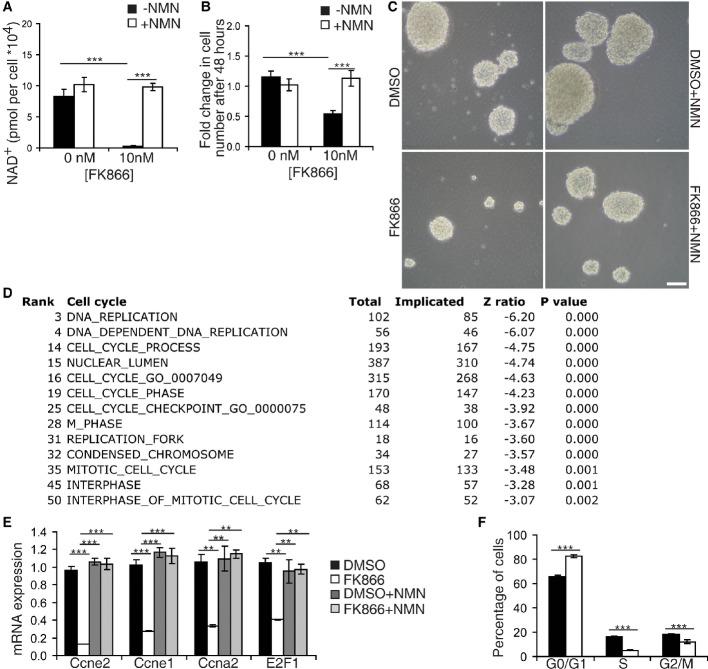
Neurospheres were cultured with the Nampt-specific inhibitor FK866 (10 nM) with or without
NMN (100 μM) for 48 h.
HPLC analysis of NAD+ levels (n = 6).
Quantification of the fold increase of cell number in neurospheres
(n = 6–30).
Representative bright-field image of neurospheres. Scale bars denote 10 μm.
Cell cycle-related pathways among the top 50 biological pathways downregulated by FK866.
Parametric analysis of gene enrichment (PAGE) was conducted based on microarray analyses. See the
Materials and Methods section.
Quantitative RT–PCR results for mRNA expression of cyclin E2 (Ccne2),
cyclin E1 (Ccne1), cyclin A2 (Ccna2), and E2F1
(n = 3).
FACS analysis of FK866-treated NSPCs (n = 8).
Data information: Data are presented as mean ± SEM.
*
P < 0.05,
**
P < 0.01,
***
P < 0.001; n.s., not significant.

