
Figure 2. Nuclear ARRB1 levels correlate with the aggressiveness of the cell line.
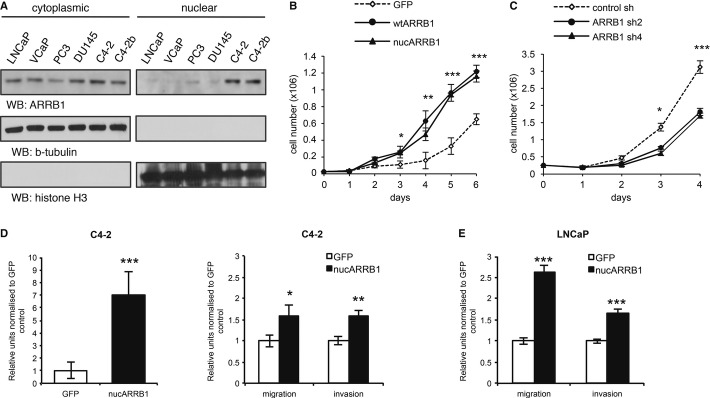
- Cytoplasmic versus nuclear levels of ARRB1 in a panel of prostate cancer cell lines.
- GFP control, nucARRB1 and wtARRB1 proliferation.
- Proliferation of ARRB1 KD C4-2 cells compared to control.
- Anchorage-independent growth (left) and migration/invasion (right) potential of C4-2 cells expressing GFP control or nucARRB1.
- Migration/invasion potential of low ARRB1 LNCaP cells expressing GFP control or nucARRB1.
Data information: (B and C) N = 3, (D and E) N = 6, values are mean ± s.e.m., *P < 0.05, **P < 0.01, ***P < 0.001.
Source data are available online for this figure.