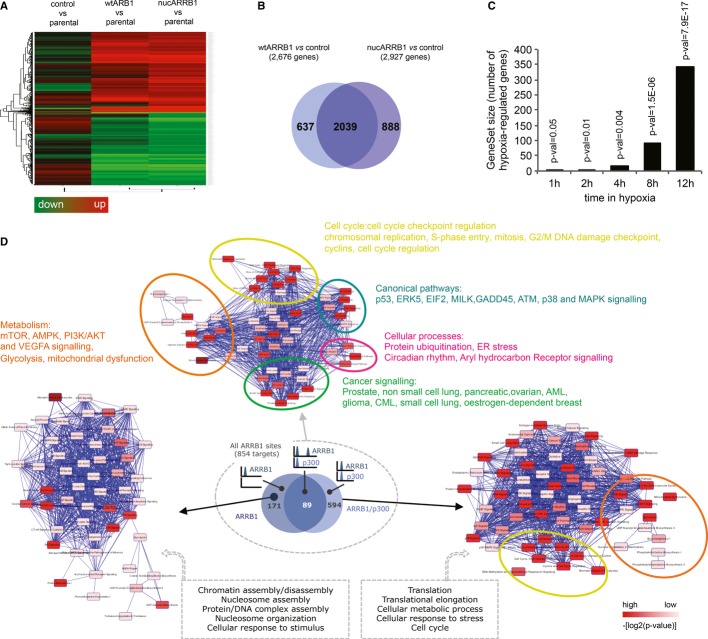
Figure 4. Characterisation of the ARRB1 transcriptome.
- Gene expression heatmap showing ARRB1-regulated genes in control GFP, wtARRB1 or nucARRB1 versus parental C4-2 control.
- Overlap between DEG in wtARRB1 and nucARRB1.
- GSEA-enrichment analysis for hypoxia-responsive genes between normoxic nucARRB1 DEG and DU145 prostate cancer cells incubated for 1, 2, 4, 8 and 12 h in hypoxic conditions.
- Ingenuity Pathway Analysis (IPA) of the 854 direct ARRB1 transcriptional targets. The small Venn diagram cartoon shows the number and overlap of genes in the different categories. IPA analyses of the p300/ARRB1- or ARRB1 alone-regulated genes subgroups are also shown.

