Figure 2.
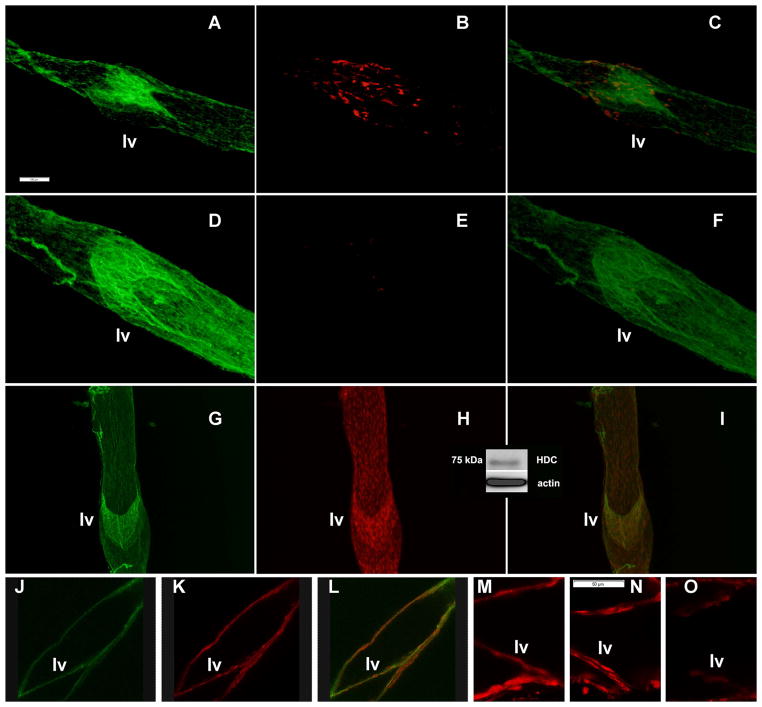
Representative epifluorescence (Panels A–I) and confocal fluorescence (Panels J–O) images of rat isolated mesenteric lymphatic vessels. CD31 (PECAM-1) is stained in green to indicate lymphatic endothelial cell junctions and therefore to delineate location of lymphatic endothelial cells and lymphatic valves (lv).
A–C: Histamine (stained in red) in control MLVs cultured overnight.
D–F: Histamine (stained in red) in α-MHD-treated MLVs cultured overnight.
G–I: Axial view of MLVs stained for histidine decarboxylase (stained in red).
J–L: Cross sectional view of MLVs stained for histidine decarboxylase (stained in red).
M–O: Cross sectional view of MLVs stained for histidine decarboxylase (stained in red). M - presence of HDC signal inside lymphatic valves in control MLVs; N - scrambled morpholino constructs were not able to change HDC signal; O - specific HDC-targeted morpholino constructs were able to deplete HDC signal.
Merged images (Panels C, F, I and L) demonstrate localization of histamine or histidine decarboxylase inside the lymphatic endothelial cells.
Insert (between Panels H and I) demonstrates representative western blot analysis of histidine decarboxylase in MLVs.
Scale bar on Panel A represents 100 μm and applies to images on Panels A–L, scale bar on Panel M represents 50 μm and applies to images on Panels M–O.

