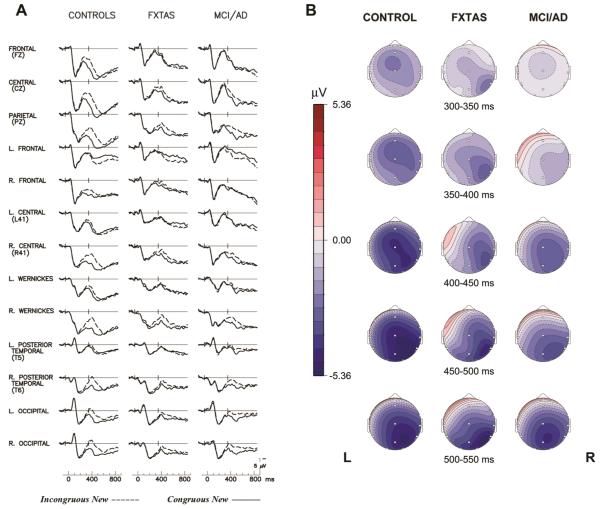
Figure 1.
The N400 Congruity Effect. (A) Grand average ERPs to congruous new (solid line) and incongruous new target words (dashed line) in 3 groups. The NC group’s N400 peak to incongruous new words is labelled ‘N4’ in the right Wernicke's (Wr) channel tracing. (B) Scalp topography maps of N400 congruity effect (voltage difference to new incongruous– congruous words) in 3 groups. L= left, R= right.

