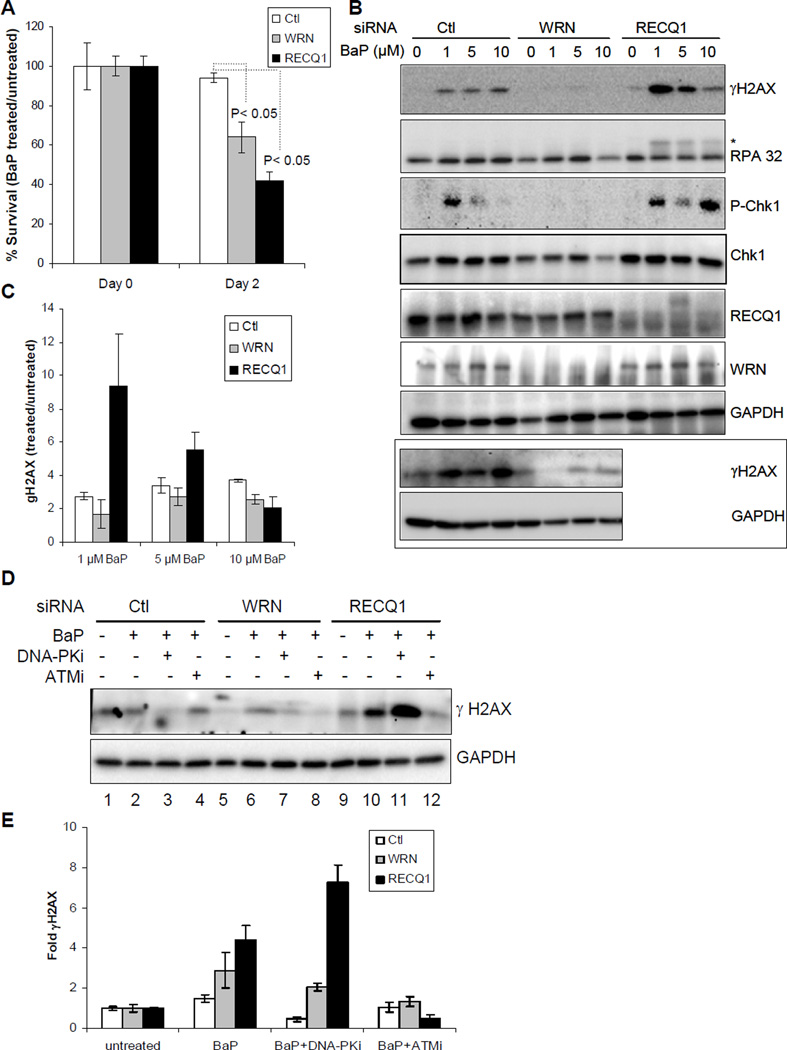
Figure 2. Cell survival and response to BaP treatment.
A. Cell survival following BaP treatment (1 µM, 48 h). Surviving fraction is presented as the mean ± SD of three independent experiments. Statistical significance of differences in survival is indicated by P value. B. DNA damage response. Lysates prepared from cells treated with indicated dose of BaP for 24 h were used for Western blotting with indicated antibodies. Western blot of γH2AX in control and WRN-depleted cells from an independent experiment is included in boxed panel. Phosphorylated RPA32 is indicated by asterisk. C. BaP-induced γH2AX levels. Relative fold enrichment in γH2AX was quantitated as in Figure 1D, and mean ± S.E.M. from three independent experiments are shown. D. Pharmacological inhibition of ATM or DNA-PK prior to BaP exposure. Lysates prepared from cells treated with BaP (1 µM, 24 h) with or without pre-treatment with indicated kinase inhibitor were used for Western blotting with indicated antibodies. E. Fold change in γH2AX. Relative fold enrichment in γH2AX was quantitated from experiments represented in panel D after normalizing with GAPDH. Data represents mean of three independent experiments with S.E.M. shown by error bars. Ctl, control; DNA-PKi, DNA-PK inhibitor; ATMi, ATM inhibitor; GAPDH serves as loading control.

