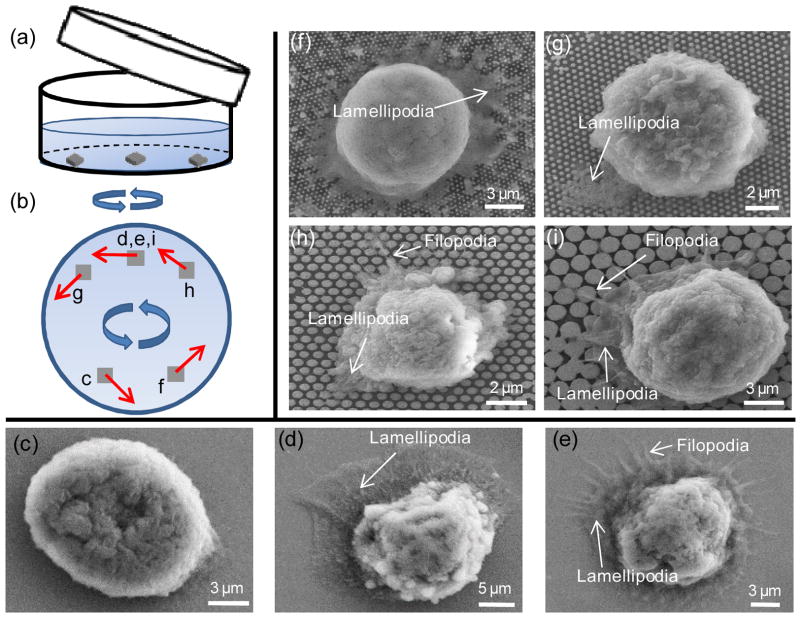
Fig. 5.
Schematics of experimental setup and SEM images showing the cell-NP interactions (lamellipodia and filopodia) for different NP substrates. (a) A schematic of the experimental setup during shaking. (b) shows the corresponding locations on wafer substrates for (c)–(i), with corresponding flow directions marked in red arrows. (c)–(e) show cell behaviors on planar wafers with shaking speeds of 0, 60 rpm and 400 rpm, respectively. (f)–(i) show cell behaviors in NP120, NP200, NP 550 and NP1100 with an average spacing of 140 nm, respectively. Typical lamellipodia and filopodia are annotated in each figure. Orientations of (c)-(i) have been adjusted to be the same as that in (b).

