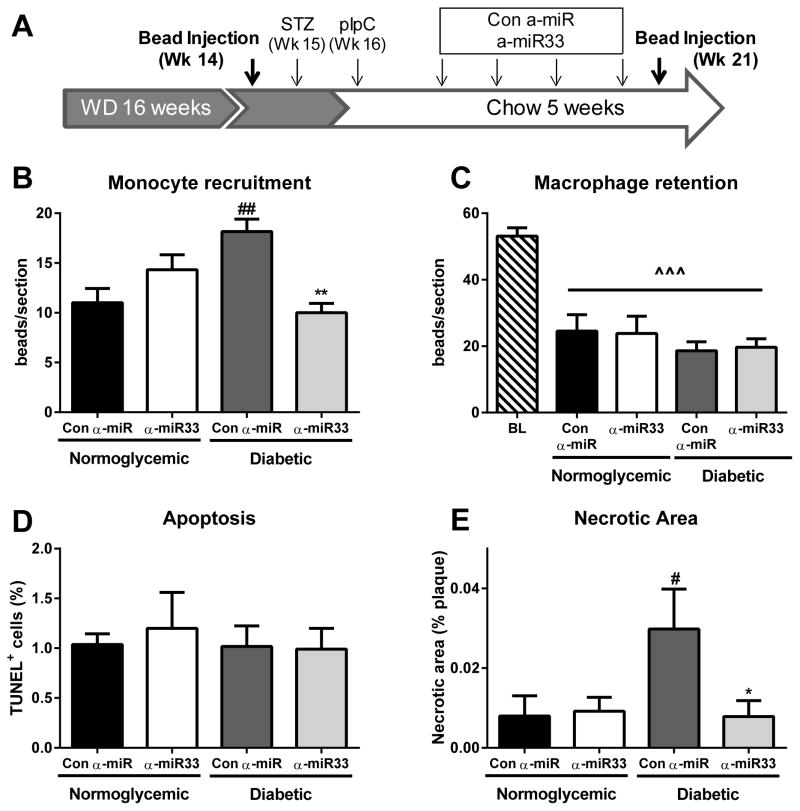
Figure 3. α-miR33 treatment affects monocyte trafficking to the plaque.
Experimental design for monocyte trafficking. (A) Reversa mice were injected with fluorescent latex beads either 24h prior to harvesting (week 21) for the recruitment protocol or at week 14 of western diet for the egress protocol. (B) To assess monocyte recruitment mice were injected with fluorescent latex beads 24h prior to sacrifice, and beads counted in the aortic root. Data are expressed as mean ±SEM (n≥6 per group). ## p≤0.01 vs. con α-miR normoglycemic ** p≤0.01 vs. con α-miR diabetic. (C) To assess macrophage retention mice were injected with fluorescent latex beads at week 14, and the number of beads remaining at sacrifice used to assess macrophage retention (baseline was established 1 week post bead injection). Data are expressed as mean ±SEM (n≥6 per group). ^^^ p≤0.001 vs. baseline. (D) Quantitative analysis of TUNEL+DAPI+ cells per section in the aortic root, after regression. Results are expressed as the percentage of total cells per plaque ±SEM (n=4 per group). (E) Quantitative analysis of necrotic core area as a percentage of total plaque area ±SEM (n≥6 per group) # p≤0.5 vs. con α-miR normoglycemic * p≤0.01 vs. con α-miR diabetic.

