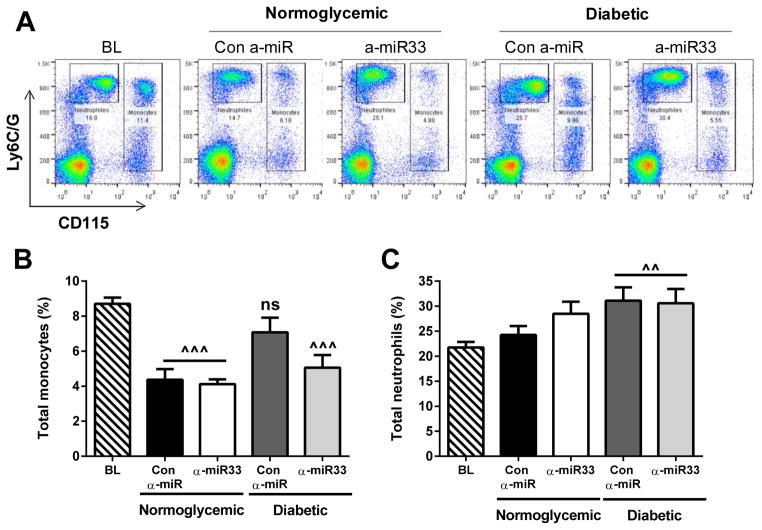
Figure 4. α-miR33 treatment decreases monocytosis in diabetic mice.
Total monocytes and neutrophils were analyzed by flow cytometry in the blood at 16 weeks of diet (baseline) or after treatment. (A) Representative flow cytometry plots. Quantification of (B) monocytes and (C) neutrophils. Data are expressed as mean ±SEM (n≥10 per group). ^^p≤0.01, *** p≤0.001 vs. baseline.

