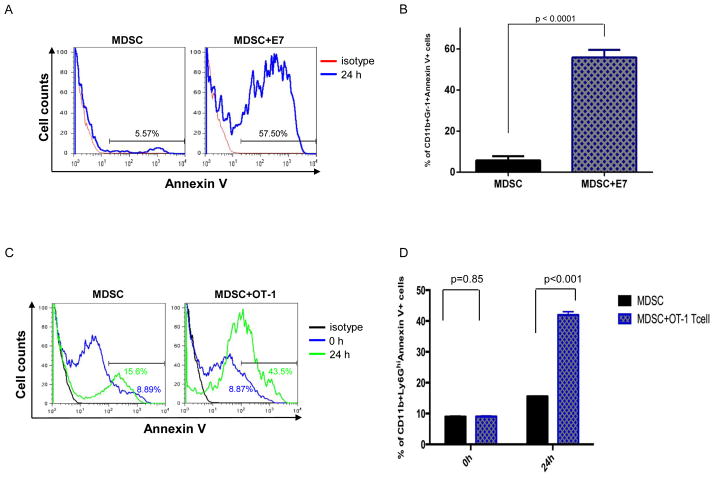
Figure 6. Activated CD8+ T cells directly induced apoptosis of MDSCs.
Purified splenic CD11b+ Ly6GHi MDSCs incubated with E7-specific T cells, OT-1 T cells or medium control for up to 24 hours. A. Representative flow cytometry histograms depicting the frequency of CD11b+ Ly6GHi Annexin V+ MDSC co-cultured with E7-specific T cells. B. Bar graph quantification of the data A (mean ± S.E.). C. Representative flow cytometry histograms depicting the frequency of CD11b+ Ly6GHi Annexin V+ MDSCs co-cultured with OT-1 T cells. D. Bar graph quantification of the data C (mean ± S.E.).

