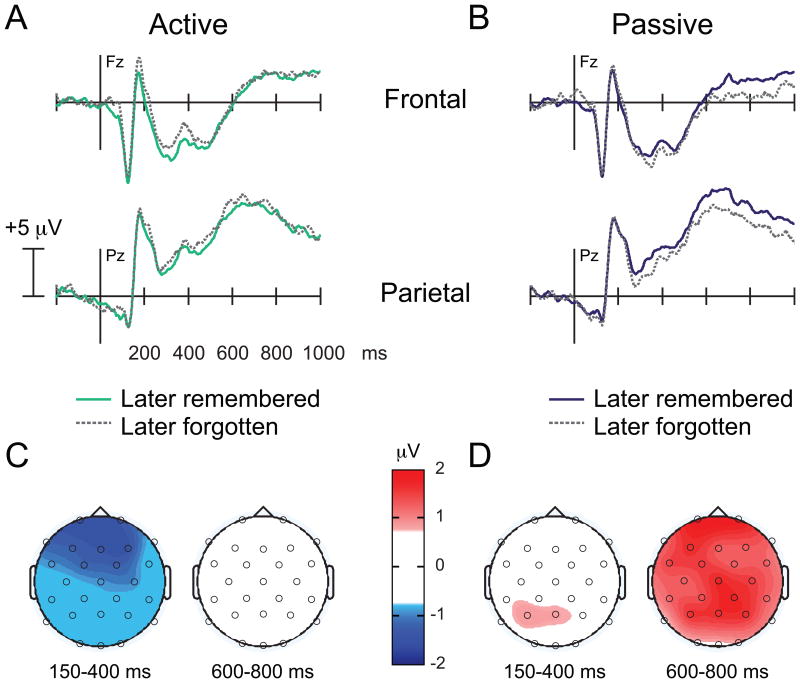
Figure 4. Dm effects.
ERPs time-locked to faces during encoding as a function of subsequent memory. (A-B) Dark solid lines depict later remembered faces; dashed grey lines depict later forgotten faces for the (A) Active and (B) Passive condition. (C-D) Topographic maps depict the difference between later remembered and later forgotten faces for the (C) Active and (D) Passive condition. Whereas negative differences between 150-400 ms predicted subsequent memory of the faces in the Active condition, positive differences between 600-800 ms predicted subsequent memory of the faces in the Passive condition.

