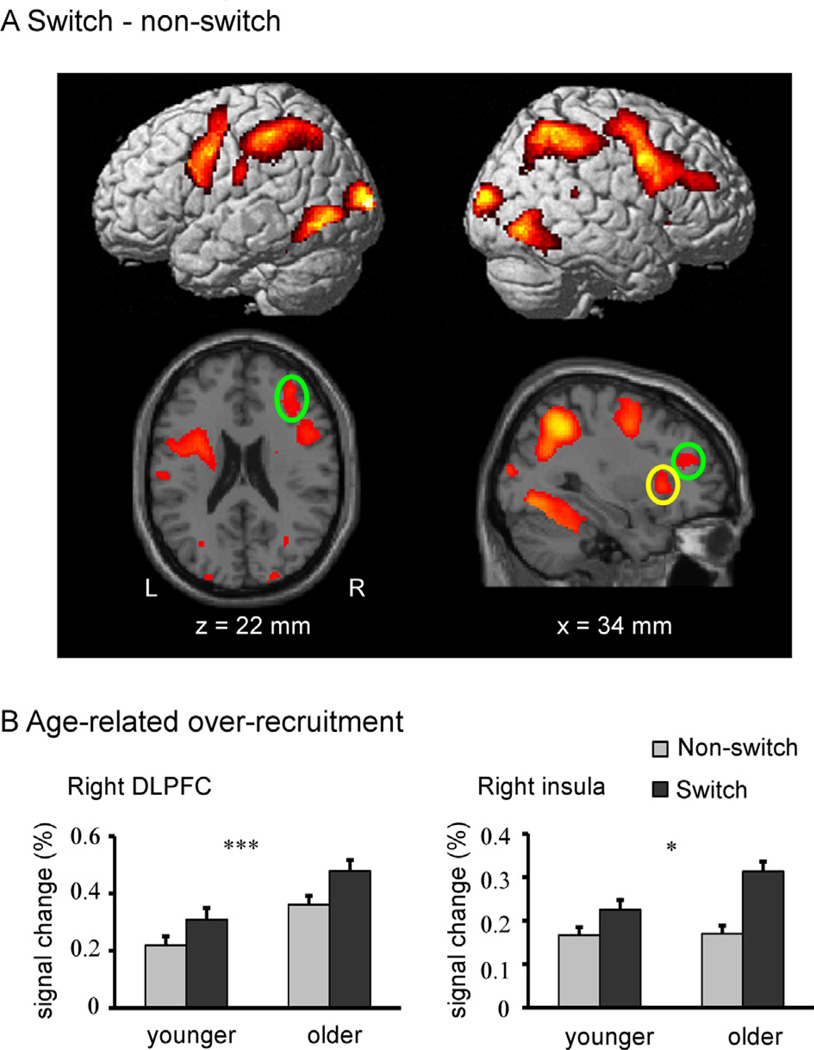
Fig. 2.
fMRI results. (A) Voxelwise activation map of the switch vs. non-switch contrast across all subjects presented on the rendered SPM surface (top panel) and slices of a T1 image (bottom panel). The two right frontal ROIs selected from the voxelwise results are indicated by circles (yellow circle for the right insula and green circle for the right DLPFC). (B) Age-related task switching over-recruitment in the two frontal ROIs. Note: Asterisks represent main effects of age. *p < 0.05, ***p < 0.001. The error bars represent the standard error of the mean. (For interpretation of the references to color in this figure legend, the reader is referred to the web version of this article.)

