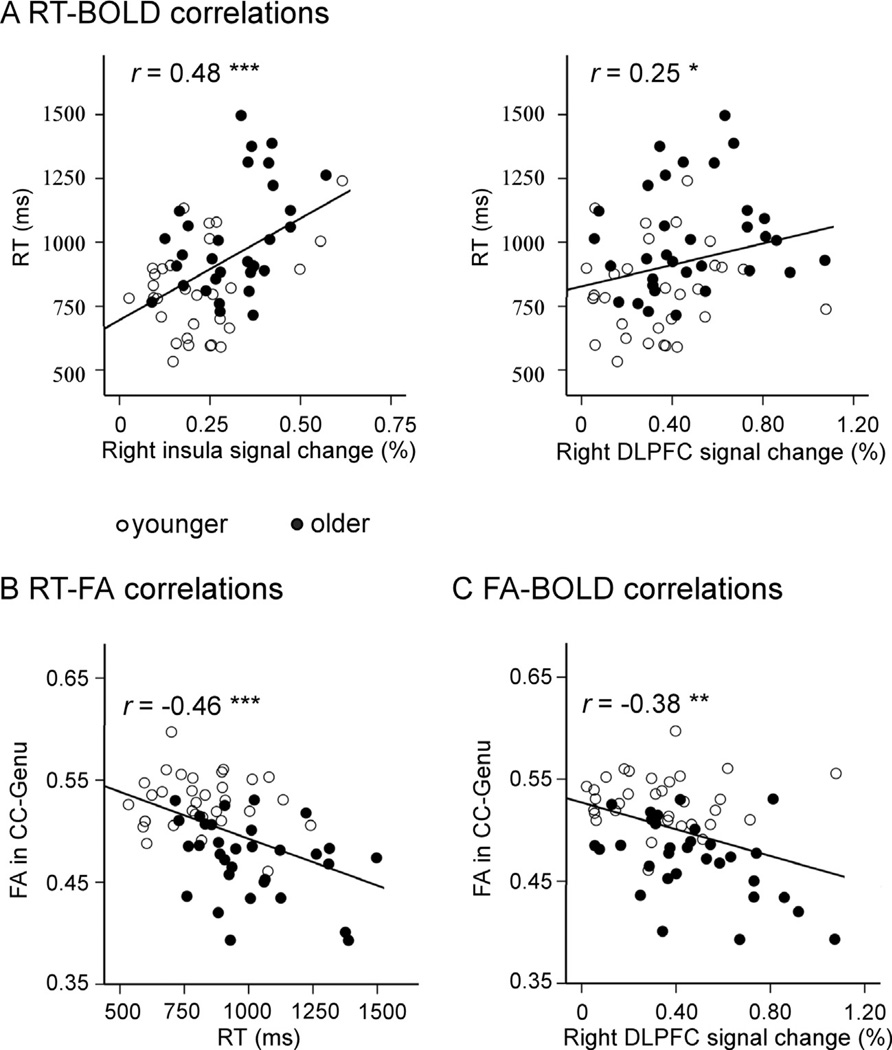
Fig. 4.
Scatter plots of significant correlations across groups. (A) Positive correlations between RT and BOLD magnitude in right frontal ROIs. (B) Negative correlation between RT and FA in CC-Genu. (C) Negative correlation between FA in CC-Genu and BOLD magnitude in the right dorsolateral prefrontal cortex (DLPFC). Note: * for p < 0.05, ** for p < 0.01, *** for p < 0.001.

