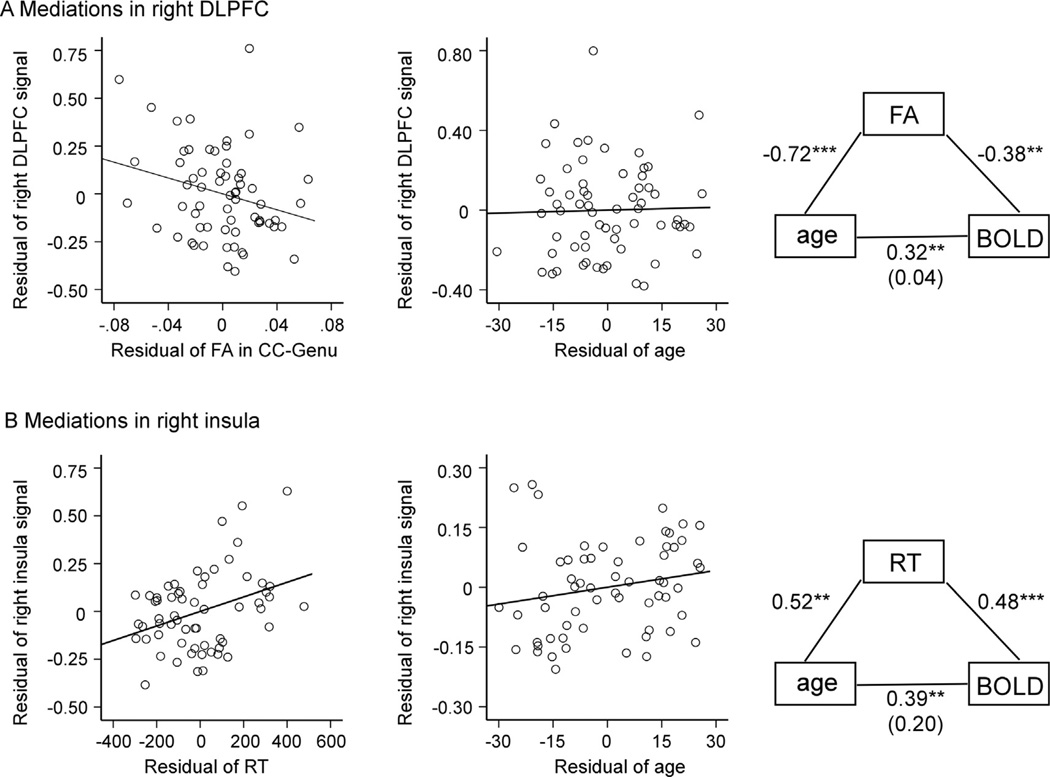
Fig. 5.
Scatter plots of relationships from mediation analyses. (A) Plots show a significant residual association between BOLD magnitude in the right DLPFC and FA in CC-Genu after controlling for age, and the lack of residual association between BOLD magnitude in the right DLPFC and age after controlling for FA in the CC-Genu. A graphical representation of the FA mediation effect is shown in the right column. The age-BOLD correlation after partialling out variance associated with FA is shown in parentheses. (B) Plots show a significant residual association between BOLD magnitude in the right insula and RT after controlling for age, and the lack of residual association between BOLD magnitude in the right insula and age after controlling for RT. A graphical representation of the RT mediation effect is shown in the right column. The age-BOLD correlation after partialling out variance associated with RT is shown in parentheses. Note: ** for p < 0.01, *** for p < 0.001.

