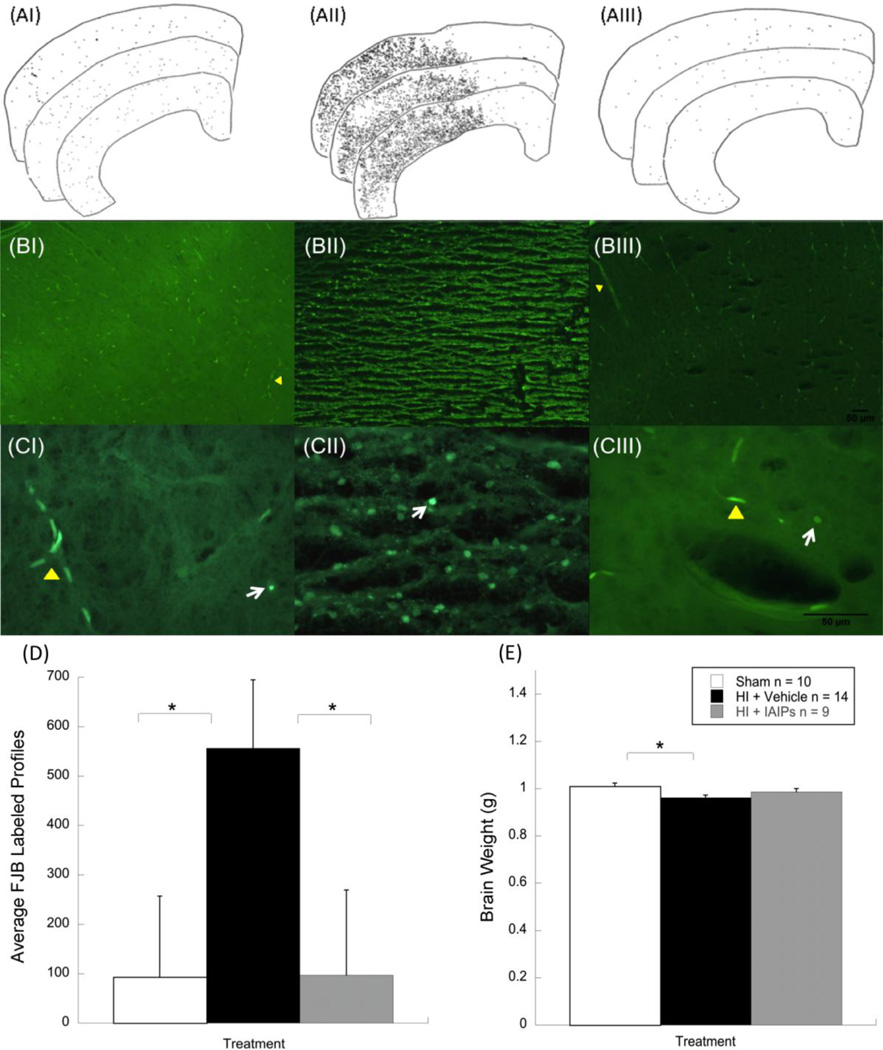
Fig. 2.
Line tracings from right cerebral cortices showing FJB positive cell distributions across three serial sections from representative sham (AI) HI+vehicle (AII) and HI+IAIP (AIII) subjects. Representative photomicrographs showing FJB positive cells from sham (BI) HI+vehicle (BII) and HI+IAIP (BIII) subjects at 10x and 40x (C) magnification. White arrows indicate FJB positive cells. Yellow markers indicate vascular elements. Histograms showing FJB labeled cells (D) and brain weight (E) differences across the three treatment groups. Comparisons show an effect of HI injury between HI+vehicle and sham subjects and an effect of treatment between HI+vehicle and HI+IAIP subjects (*P < 0.05, one tail). Brain weight comparisons show an effect of injury between sham and HI+vehicle animals (*P < 0.05).

