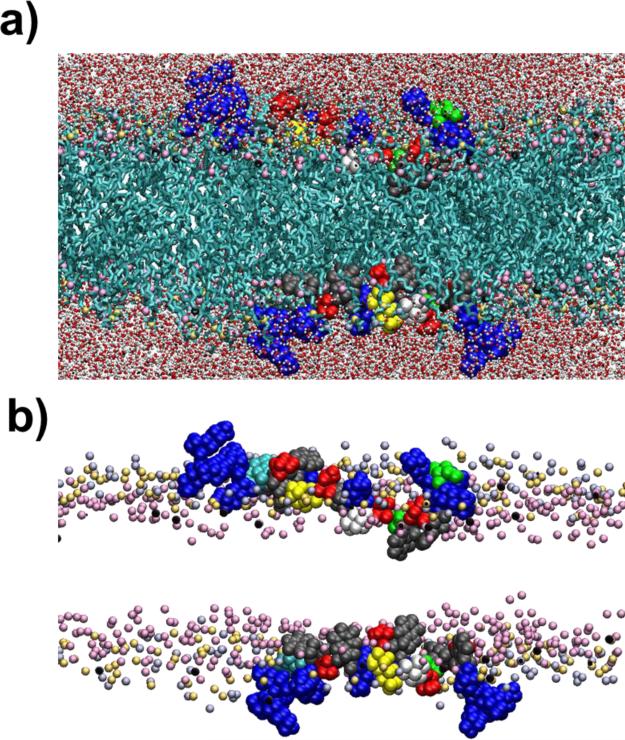
Figure 1.
Atomistic model of MARCKS-ED interacting with membrane bilayers. a) Snapshot showing MARCKS-ED binding to the membrane bilayers after 40 ns of simulations using the CHARMM forcefield. Lipid tails are shown in cyan. Water molecules are shown in stick and ball representation with the oxygen atoms shown in red and the hydrogen atoms in white. Lysine residues of MARCKS-ED are shown in blue, phenylalanine in gray and serine in red. The residue in yellow is the Lys residue that was mutated into Cys for the sequential EPR experiments. The lipid head groups are shown as: choline nitrogen (light violet), phosphate phosphorus (light yellow) and one of the sn-2 carbonyl oxygen (pink). For clarity, atoms in the foreground are not shown and the size of the head group atoms have been decreased. b) A different view with the lipid tails and water molecules removed. Colors and representations are the same as that in a).

