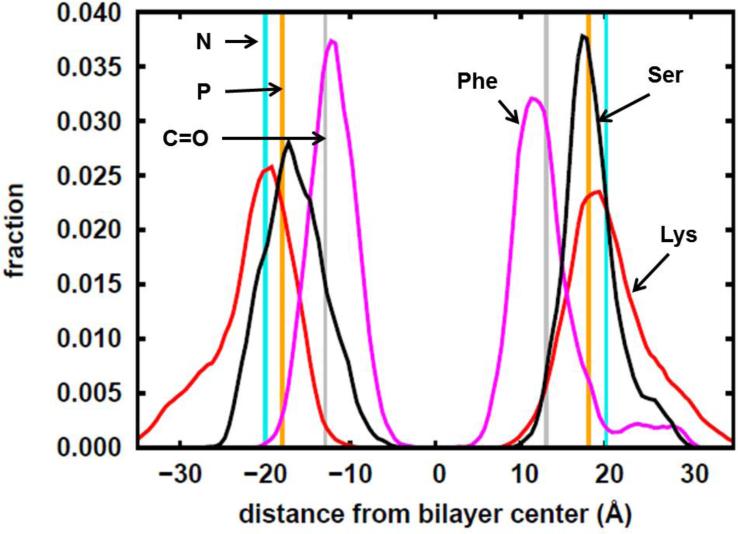
Figure 2.
Histograms calculated from the simulation trajectory showing the distribution of the z-coordinates of the side-chain centers of mass of the Lys, Phe and Ser residues of the MARCKS-ED peptide. N, P and C=O respectively refer to the average positions of the nitrogen, phosphorus and carbonyl carbon atoms of the lipid molecules. The z-coordinates are relative to the bilayer center where z=0.

