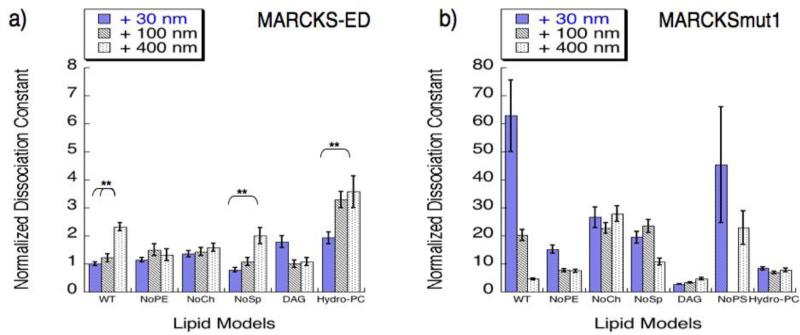
Figure 5.
Membrane curvature sensing by a) MARCKS-ED and b) MARCKSmut1 in vesicles with different lipid composition. KD values were determined by fluorescence anisotropy assays for each lipid vesicle size and composition (Table S2). For direct comparison, all KD values were normalized to that for wild type 30 nm vesicle by MARCKS-ED. *P value < 0.01 compared to vesicles generated by 400 nm polycarbonate membrane pores. **P value < 0.05 compared to vesicles generated by 400 nm polycarbonate membrane pores, indicating curvature sensing behavior. Statistical analysis was performed using the Analysis of variance (ANOVA) test to produce a p-value between samples measured.

