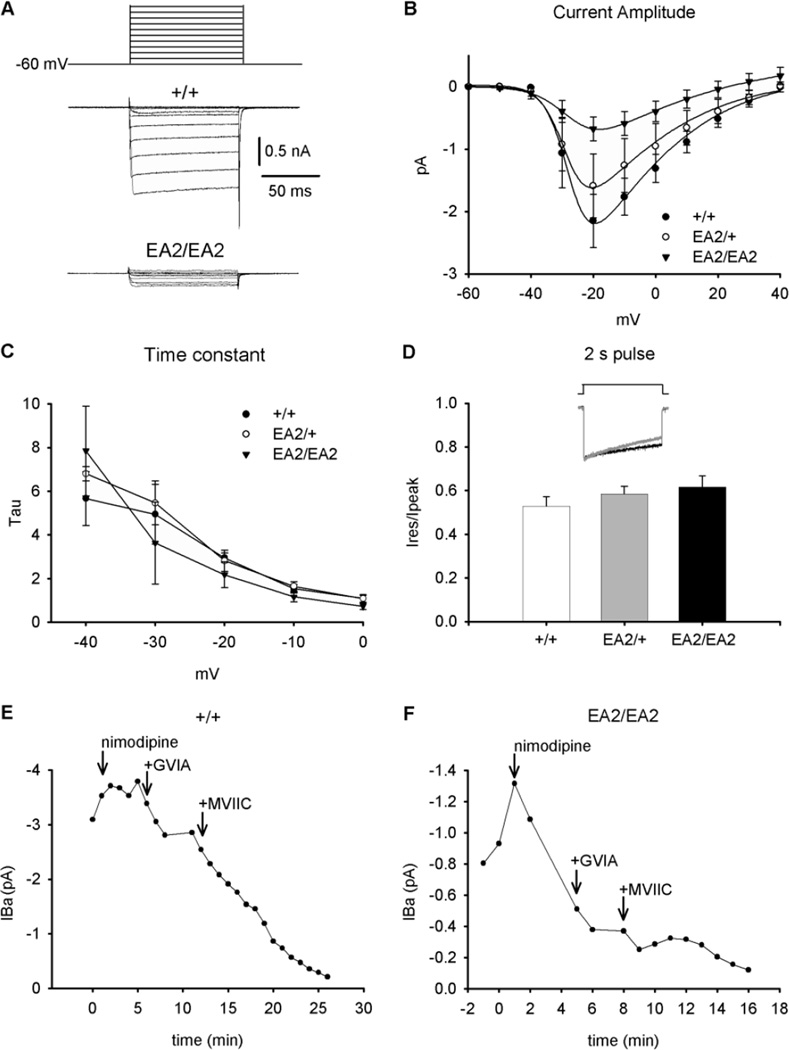
Fig. 2.
Physiological properties of EA2 knockin (p.F1406C) CaV2.1 (A) Depolarizing voltage pulses (100 ms) ranging from −60 to + 40 mV (top) were applied to acutely dissociated PCs in the presence of CaV1.2 and CaV2.2 antagonists, and Ba2+ currents (IBa) were measured. Representative traces from +/+ and EA2/EA2 mice are shown (bottom). (B) Current-voltage (I-V) relationships were plotted for +/+ (n=7), EA2/+ (n=3), and EA2/EA2 (n=4) PCs using the voltage protocol shown in (A). Symbols represent mean + SEM. (C) Peak IBa vs. time was recorded for +/+ and (D) EA2/EA2 PCs during 100 ms depolarizations from −60 to −20 mV. Arrows indicate the sequential addition of Ca2+ channel blockers (5 µM nimodipine (CaV1.2), 3 µM ω-conotoxin MVIIC (CaV2.1), 1 µM ω-conotoxin GVIA (CaV2.2)).

