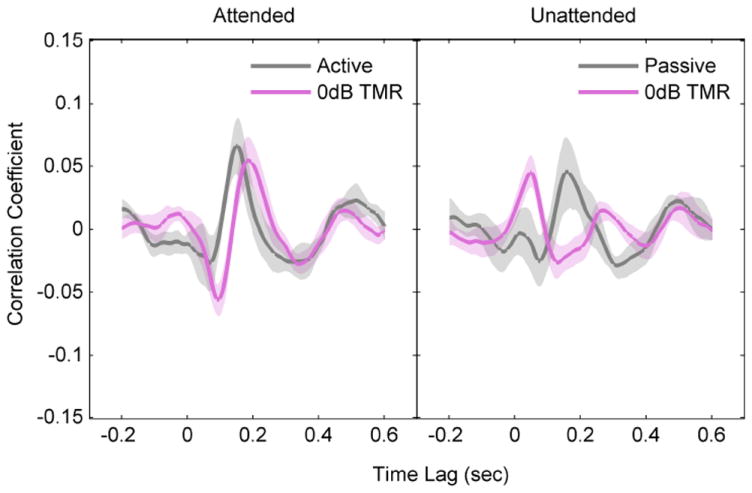
Figure 5.

Correlation coefficients between the EEG and the speech envelope at different time lags. Left panel compares cross-correlations for the attended speech for the Q and CS conditions. Right panel compares the results for the unattended speech. Shaded areas denote 95% confidence interval (CI) of the cross-correlations.
