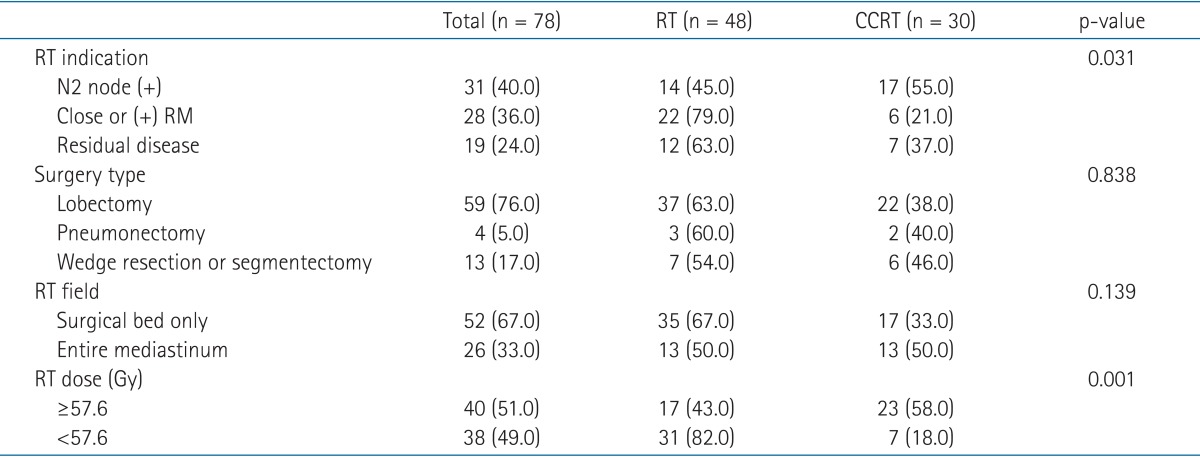
Table 2.
Treatment related factors by the treatment arms

Values are presented as number of patients (%).
RT, radiotherapy; CCRT, concurrent chemoradiation; RM, resection margin.
Treatment related factors by the treatment arms

Values are presented as number of patients (%).
RT, radiotherapy; CCRT, concurrent chemoradiation; RM, resection margin.