Figure 7.

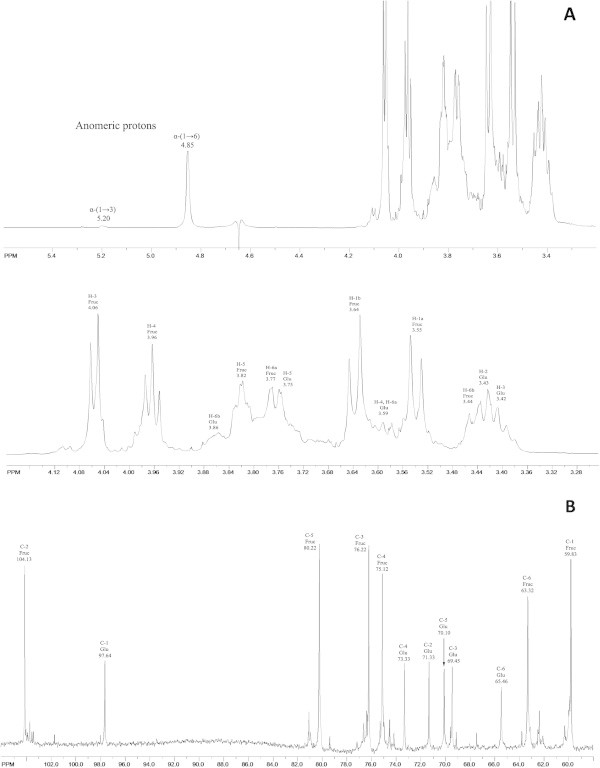
RMN spectra of EPSB-soluble and cell-associated fractions. (A) Full 1H NMR spectrum (upper graph) and region between 4.2 and 3.1 nm (bottom graph). (B) 13C-NMR spectrum.

RMN spectra of EPSB-soluble and cell-associated fractions. (A) Full 1H NMR spectrum (upper graph) and region between 4.2 and 3.1 nm (bottom graph). (B) 13C-NMR spectrum.