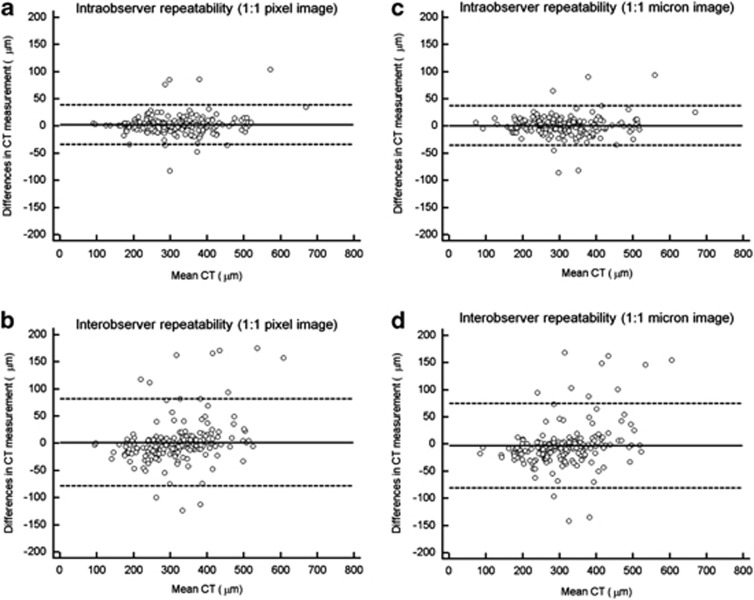
Figure 2.
Bland–Altman plot of two subfoveal choroidal thickness (CT) measurements. These graphs plot the difference against the average of two measurements, with 95% limits of agreement (broken lines) and the mean difference (black line). (a, c) Shows intraobserver repeatability and (b, d) indicates interobserver repeatability. Bias increased from CT≥300 μm regardless of the image mode performed by a single observer (a, c). An increasing tendency in bias was exhibited from ≥200 μm in the CT measurements performed by the two observers (b, d).

