
Figure 2.
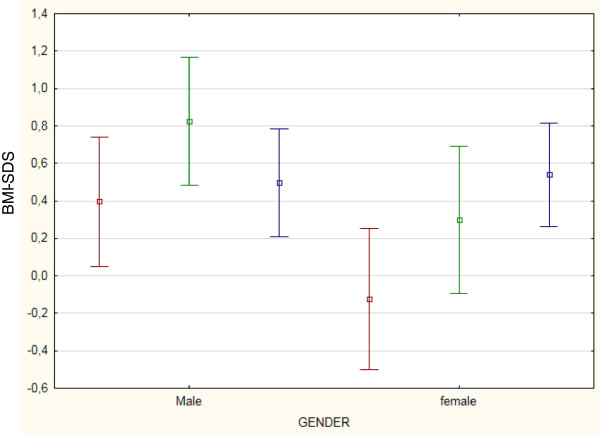
Mean BMI-SDS changes with time in both gender. Legend: Data at diagnosis of ALL (sT) are colored in red. Data at the end of treatment (EoT) are colored in green. Data at final height (FH) are colored in blue.
Official websites use .gov
A
.gov website belongs to an official
government organization in the United States.
Secure .gov websites use HTTPS
A lock (
) or https:// means you've safely
connected to the .gov website. Share sensitive
information only on official, secure websites.
Mean BMI-SDS changes with time in both gender. Legend: Data at diagnosis of ALL (sT) are colored in red. Data at the end of treatment (EoT) are colored in green. Data at final height (FH) are colored in blue.