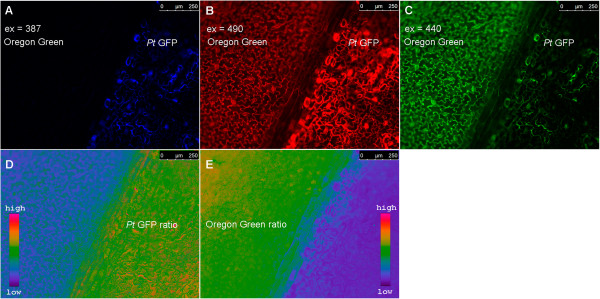
Figure 5.

Principle of ratiometric analysis using two pH indicators within a single image frame. Fluorescence images shows adaxial view of Vicia faba leaf as excited at (A) F 387, (B) F 490 and (C) F 440. Leaf apoplast as loaded with the pH-indicator protein Pt-GFP (right of leaf vein) and the pH-indicator dye Oregon Green-dextran 488 (left of leaf vein). Images were captured approximately 3 hours after loading. The fluorescence ratios (D) F 490/F 387 (Pt-GFP) and (E) F 490/F 440 (Oregon Green 488-dextran) were obtained as a measurement of pH. Emission was collected at 510/84 for both Pt-GFP channels and 535/25 for both OG channels. For this reason, the F 490 channel was captured two times, once with emission 510/84, then with emission 535/25 (only the 535/25 emission image is shown in this figure). The ratios were coded by hue on a spectral colour scale ranging from purple (no signal) to blue (lowest signal) to pink (highest signal). Following this new loading strategy, leaf regions loaded with different indicators could be monitored and ratios were calculated according to the optimal wavelength of the respective indicator.
