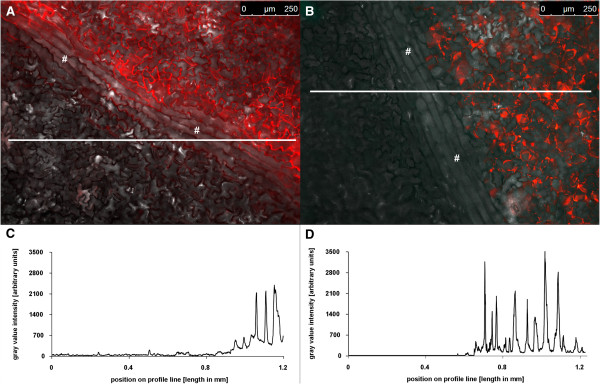
Figure 6.

Leaf vein as a structural barrier that separates apoplastically located dyes. Adaxial leaf apoplast partially loaded with (A) Oregon Green 488-dextran or with (B) Pt-GFP. Overlay of pseudo-red fluorescence image at F490 and corresponding bright field image captured approximately 3 hours after loading. Dye-loaded areas in (A) and (B) appear red. Areas that were not loaded with the fluorescent pH reporter appear grey when illuminated and serve as a suitable area to compare the amount of unspecific signals (background) to specific signals being emitted from the pH reporters. For this, the intensity of grey values was chosen as a measure for emitted signal intensity. A profile of the intensity values was taken from the white line in (A) and is presented in (C). The same was done for the Pt-GFP: The intensity values were taken from the white line in (B) and are presented in (D). Only negligible signals were emitted from the areas without pH indicator that were separated by the leaf vein from the loaded apoplast. Signals were markedly higher in the dye-loaded areas. #, leaf vein. Results were confirmed by 10 replicates captured from different plants.
