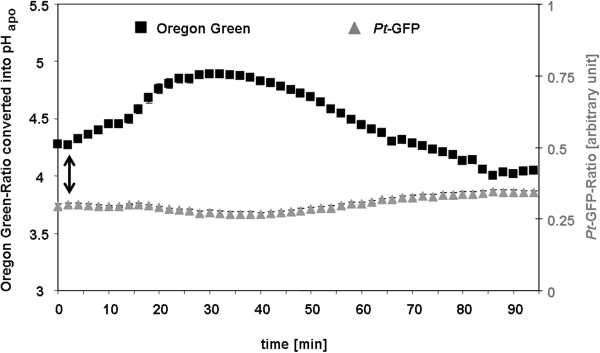
Figure 7.

Unsuitability of Pt -GFP in the acid leaf apoplast of Vicia faba . Comparison between the responsiveness of the pH indicator protein Pt-GFP (grey) and the pH indicator dye Oregon Green (black) to apoplastic pH changes as induced by the addition of 50 mM Cl− via L-cysteinium chloride to the roots of Vicia faba. Time point of chloride addition is indicated by the arrow. pH, as quantified at the adaxial face of Vicia faba leaves is plotted over time. Fluorescence ratio data obtained by Pt-GFP were below the linear range of the in vivo pH calibration and, therefore, could not be converted into pH data. Leaf apoplastic pH quantification was averaged (n = 6 ROIs per ratio image and time point; mean ± SE of ROIs). Representative kinetics of eight equivalent recordings of plants gained from 8 independent experiments.
