
Figure 8.
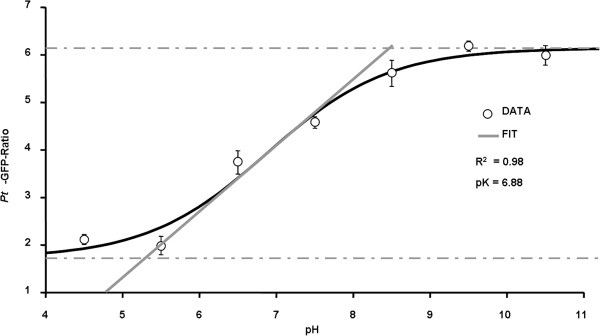
In vivo calibration of Pt -GFP fluorescence ratio (F 490 /F 387 ). The Boltzmann fit was chosen for fitting sigmoidal curves to calibration ratio data. Fitting resulted in an optimal dynamic range for pH measurements between 5.3 and 8.4. In vivo calibration was conducted on six different plants, each biological replicate was technically replicated. Data are mean of n = 6 ± SE.