Figure 8.

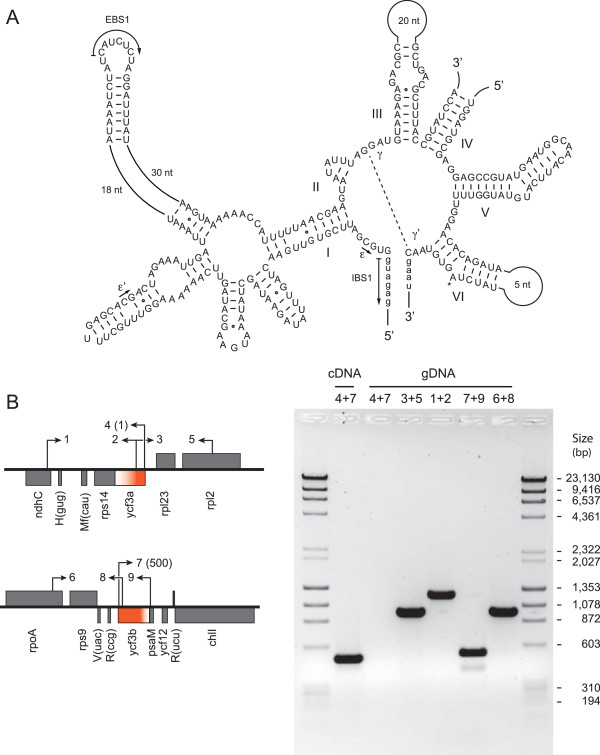
Analysis of the trans -spliced group II intron in Picocystis ycf3 . (A) Potential intron secondary structure modeled according to Michel et al. (1989) [66]. Exon sequences are shown in lowercase letters. Roman numbers specify the six major structural domains. Tertiary interactions are denoted by dashed lines, arrows, or Greek letterings. EBS and IBS are exon-binding and intron-binding sites, respectively. The asterisk indicates the site of lariat formation. Note that the precise position of the breakpoint within domain IV is unknown. (B) Confirmation of intron trans-splicing by RT-PCR analysis. The diagrams on the left display the genomic configuration of the Picocystis ycf3 exons (solid color), with the trans-spliced intron sequences shown as color gradients. Primer locations are indicated by numbered arrows (see Methods for primer sequences); the numbers in parentheses denote the nucleotide positions corresponding to the 5′ ends of the primers on the ycf3 coding sequence after intron removal. Coding regions shown above or below the horizontal line are transcribed to the right or to the left, respectively. PCR assays were carried out on cDNA or genomic DNA (gDNA), with the numbers above the gel lanes indicating the combinations of primers used. The amplicon derived from the PCR assay on cDNA is of the size expected if intron trans-splicing occurs to produce the ycf3 RNA. The identity of this amplicon as well as the insertion position of the intron in the ycf3 gene were confirmed by DNA sequencing. The amplicons derived from the PCR assays on gDNA have the sizes predicted by the genome map.
