
Figure 5.
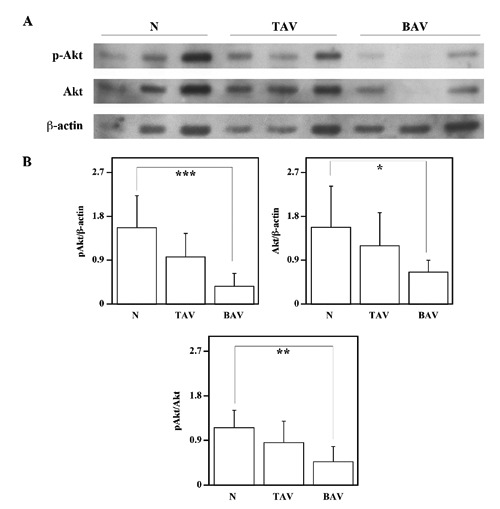
Analysis of pAkt and Akt levels in the ascending aortic wall. Comparison, by Western blotting analysis, of pAkt and Akt protein levels between ascending aortic tissues from six nonaneurysmal aortas (N), nine patients with AsAA associated to TAV and nine patients with AsAA associated to BAV (A). -actin, was used as loading control. Representative image is shown. Densitometric analysis (B). Densities of pAkt and Akt bands were measured and normalized respect to the densities of β-actin, bands. pAkt/Akt represents the ratio between the densities of pAkt and Akt bands. Data are reported as mean ± SD. *P<0.05, **P<0.01, ***P<0.001.