
Figure 2.
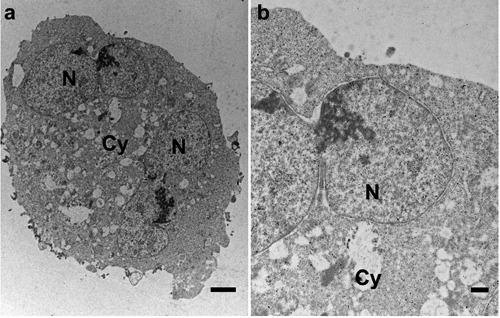
a) Subcellular visfatin distribution in HCT-116 bi-nucleated cells which had been cultured for 24 h with cytochalasin B. b) Magnified view of (a) indicating less pronounced visfatin labeling in nucleus and cytoplasm of bi-nucleated cells. Cy, cytoplasm; N, nucleus. Scale bars: a) 2 µm; b) 500 nm.