Figure 4.

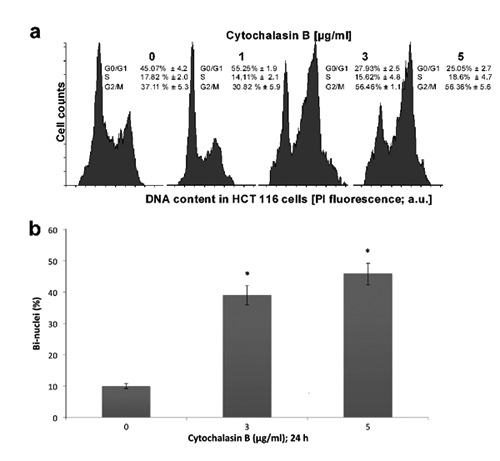
Effects of cytochalasin B on the cell cycle progression in human colorectal HCT-116 carcinoma cells. a) Cells treated with 0, 1, 3 to 5g/mL cytochalasin B for 24 h; at the end of treatment, cells were trypsinized and then subjected to flow cytometry analyses; the specific values represent the mean ±SD from 3 independent repeats; charts show the result of representative experiment. b) Nuclei stained with DAPI and percentage of binuclei assessed under a fluorescence microscope; results were obtained from four experiments, data expressed as mean ±SD. *Comparison between untreated samples and cytochalasin B-treated samples with the significance level P<0.05.
