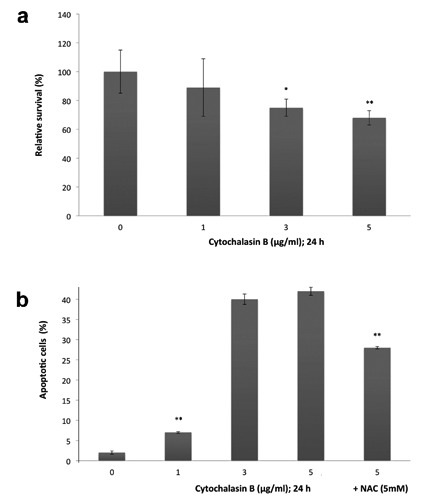
Figure 6.

Viability and apoptosis ratio of human colorectal HCT-116 cells after cytochalasin-B treatment. a) Cells treated with 0, 1, 3 to 5g/mL cytochalasin-B for 24 h, cells viability quantified by MTS assay; results were obtained from seven experiments, bars represent average relative survival rate (%) ±SD compared to control; *P<0.05 and **P<0.001 indicate comparison between untreated samples and cytochalasin B-treated samples; percent of apoptotic cells in the groups treated with CytB solely or in combination with N-acetylcysteine (NAC; 5 mM). b) Cells observed under fluorescent microscope following nuclei staining with Hoechst 33258; bars represent mean ±SD of the percentage of cytokinesis failed HCT-116 cells that underwent apoptosis; **P<0.001 vs control.
