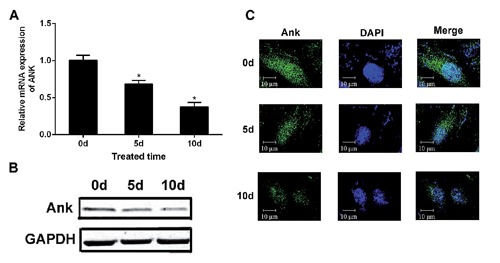
Figure 4.

ICMC induced downregulation of Ank expression. A) RT-PCR shows downregulation of Ank, expression among NC, 5d and 10d groups. B) Western blotting shows downregulation of Ank expression among NC, 5d and 10d groups; columns represent mean ± SE. *P<0.05. C) Transmembrane protein Ank (green) was assessed using immunofluorescence, blue for nucleus. Data were presented as mean ± SD, n=3. *P<0.05. All experiments were repeated at least three times. 0d, 5d, 10d, ICMC non-loading or loading for 5 and 10 days, 0d as control.
