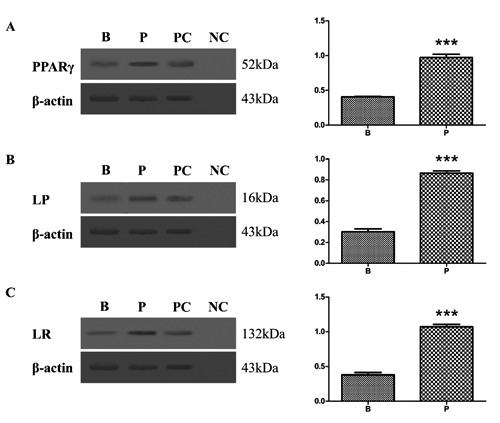
Figure 3.

Western blot of of PPAR 2, leptin and leptin receptor in the oviduct tissues of Rana dybowskii, during breeding period (B) and pre-hibernation (P). Positive bands of PPAR 2, leptin and leptin receptor were observed in the position of about 52kDa (A), 16kDa (B) and 132kDa (C) respectively. ß-actin was used as controls to correct for loading in each lane. PC, positive control; NC, negative control. The expression levels were determined by densitometric analysis. Bars represent means ±SD for three independent experiments; asterisks indicate significant difference (P<0.01).
