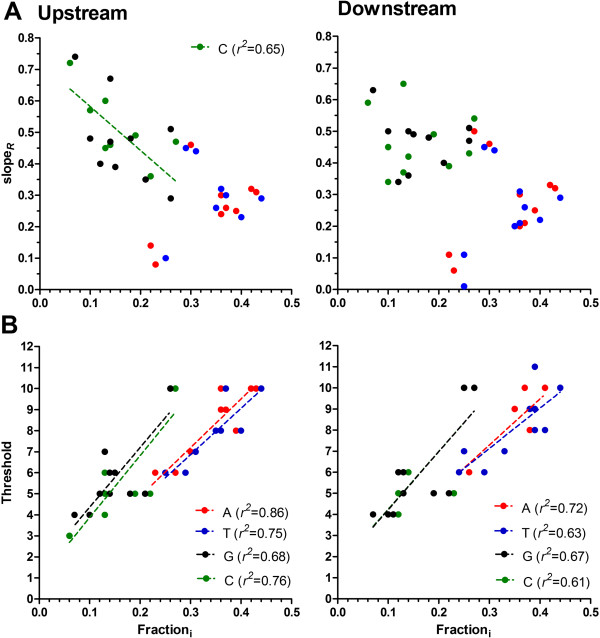
Figure 3.

Comparative analysis of overrepresentation of homopolymeric tracts as a function of nucleotide content. (A) The slope of overrepresentation (slopeR) of each homopolymer tract (see key in B) plotted as a function of the fraction of each nucleotide content (Fractioni) in upstream and downstream proximal flanking regions. Only poly dC tracts in upstream proximal flanking regions show a significant correlation as indicated. (B) The threshold of homopolymer tracti plotted as a function of Fractioni in upstream and downstream proximal flanking regions. All linear regression analyses (dotted lines) were significant, with the coefficient of correlation (r 2) reported in the key.
