
Figure 2.
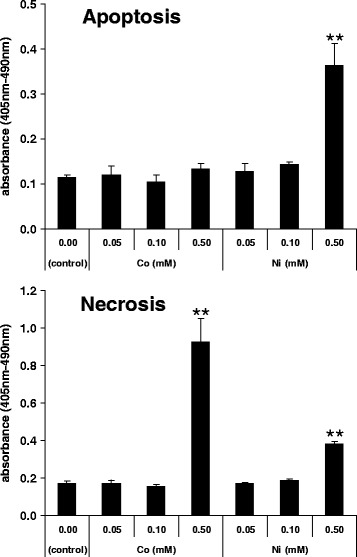
Analysis of cell death (apoptosis/necrosis) by cell death ELISA. For Co- and Ni-ion-treated groups, cytoplasmatic fraction and the supernatant of MLO-Y4 were collected to measure apoptosis and necrosis levels after 24 hr. Mean values ± SD (n =6) are represented. The asterisk indicates statistically significant difference (**p <0.01 vs. control).