Figure 4.
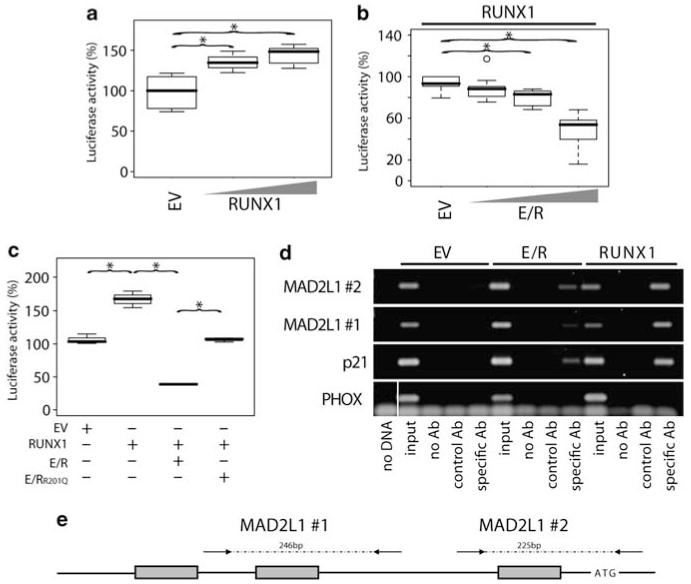
Direct regulation of MAD2L1 by RUNX1 and abrogation of this effect by E/R. Luciferase assays were performed using a 1.2 kb MAD2L1 genomic reporter fragment containing three perfect RUNX1-binding sites (a–c). NIH3T3 cells were transfected (JetPEI Polyplus transfections, Illkirch, France) with RUNX1, E/R, E/RR201Q, or a combination thereof. Cells were cotransfected with CBFβ (12.5 ng) to enhance RUNX1 binding and TK Renilla for transfection control. The total amount of DNA for each experiment was kept constant. Values obtained from EV control samples were set to 100%. Luciferase activity is depicted using (a) increasing amounts of RUNX1 pcDNA3.1-expression vector (100 and 500 ng) or (b) E/R (200, 400, and 800 ng) in addition to RUNX1 (400 ng) to show dose-dependent reporter activation by RUNX1 and its repression by E/R, respectively. Box plots of three representative experiments are depicted. Welch’s t-test, *P≤0.05. (c) NIH3T3 cells were transfected using various combinations of 267 ng empty vector (EV), E/R, or a DNA-binding mutant E/RR201Q, and/or 100 ng RUNX1-expression vector. One of three representative experiments is depicted. Welch’s t-test, *P≤0.05. (d) RUNX1 and E/R occupation of MAD2L1 promoter region in vivo was assessed by ChIP. Chromatin from Myc-tagged E/R, Myc-RUNX1, or Myc-tagged EV stably expressing HEK293 cells was immunoprecipitated with anti-c-Myc (9E11, Abcam) or control antibody (anti-N cadherin, 610920, BD). Aliquots of the isolated DNA fragments (without antibody (noAb), with control or specific Ab and input DNA) were subjected to PCR with specific primers that amplify regions of the MAD2L1 promoter (Supplementary Methods) and analyzed by DNA gel electrophoresis. Specific primers were used to amplify specific regions of p21WAF1 and PHOX promoters as positive and negative controls, respectively. The gel from one of two independent experiments is shown. A vertical line has been inserted to indicate where the gel lane was cut. These gels came from the same experiment. (e) Schematic diagram of the 1.2 kb of the promoter region of the MAD2L1 gene cloned into the pGL3. The three perfect RUNX1-binding motifs (TGT/CGGT) are indicated by gray boxes. Arrows flanking the two RUNX1 sites (#1 and #2) indicate primer positions used for PCR amplification of isolated DNA fragments after ChIP. Numbers refer to the size of the expected PCR product. Graph is not to scale.

