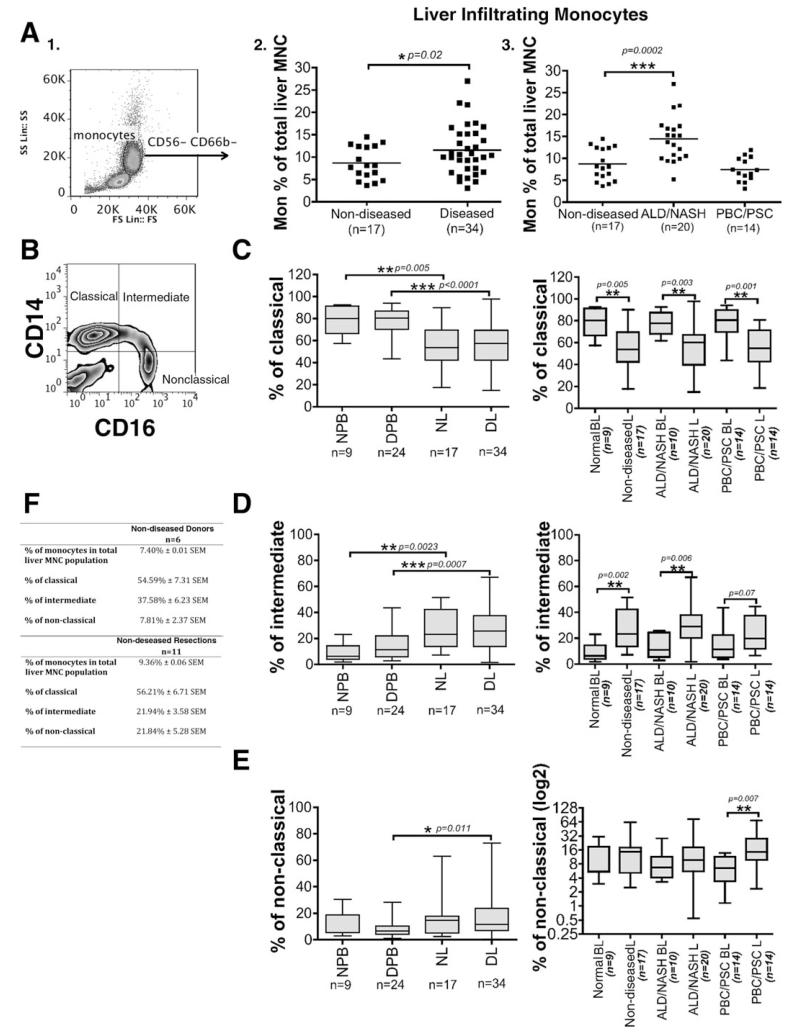
Fig. 1. Intrahepatic monocytes are expanded in human liver disease.
(A,1) Monocytes in blood and human liver were identified based on forward and side scatter and CD14/CD16 expression and exclusion of CD56+CD16+ NK cells and CD66b+CD16+ neutrophils (A,2 and A,3). The levels of monocytes were expressed as the percentage of total liver MNCs and were compared between nondiseased (donor and resections; n=17) and diseased livers (ALD [n = 17), NASH [n = 3], PBC [n = 8], and PSC [n = 6]). Each dot represents the value from each individual and the line represents the mean value ± SEM. Statistical analysis was performed via Student t test. *P = 0.02, ***P = 0.0002 versus nondiseased livers. (B) Monocytes were further divided based on the CD14 and CD16 expression into classical (CD14++CD16−), intermediate (CD14++CD16+), and nonclassical (CD14+CD16++) monocytes as shown by the representative quadrant flow cytometry plot. (C-E) The levels of classical (C, left panel), intermediate (D, left panel), and nonclassical (E, left panel) monocyte subsets are expressed as the percentage of total monocytes and were measured in normal peripheral blood (NPB [n = 9]), diseased peripheral blood (DPB [n = 24]), nondiseased livers (NL [n = 17]) and diseased livers (DL [n = 34]). The levels of classical (C, right panel), intermediate (D, right panel) and nonclassical (E, right panel) monocyte subsets were also recorded in the blood and liver of specific grouped etiologies: ALD/NASH and PBC/PSC. Horizontal bars represent the median values of the monocyte subset populations. Comparisons of the variables between the groups of blood and liver monocytes were made via Student t test. *P < 0.05, **P < 0.01, ***P < 0.001. (F) Table shows the percentage of monocytes in the total liver-infiltrating mononuclear cell population and the percentage of the three monocyte subsets in nondiseased donors (n = 6) and resections (n = 11). A Student t test revealed a significant difference (*P = 0.03) in the levels of intermediate monocytes between donors and resections.

