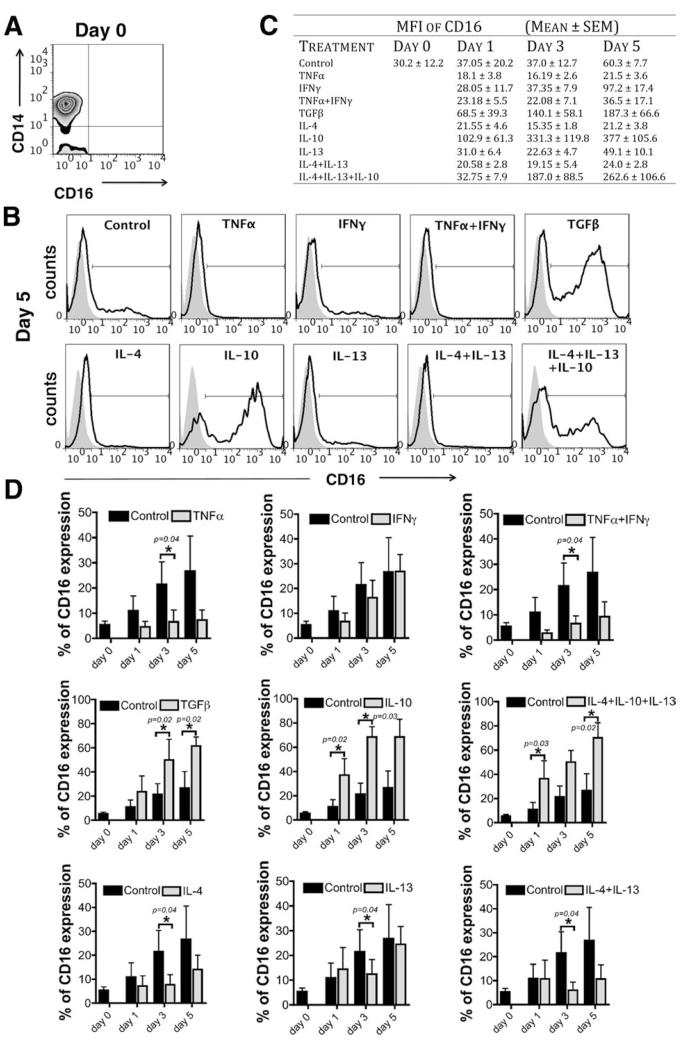
Fig. 3. Monocyte subset differentiation in vitro.
Human CD14++CD16− monocytes isolated from the blood of healthy volunteers were stimulated in vitro with TNFα (10 ng/mL), IFNγ (25 ng/mL), TNFα/IFNγ, TGFβ (5 ng/mL), IL-4 (10 ng/mL), IL-10 (50 ng/mL), IL-13 (10 ng/mL), IL-4/IL-13 and IL-4/IL-13/IL-10 for 1, 3 and 5 days, and the expression of CD16 was studied by flow cytometry. (A) Representative quadrant flow cytometry plot showing the CD14++CD16− subset at day 0 after isolation. (B) Representative flow cytometry histograms showing the induction of CD16 expression on CD14++CD16− subset after 5 days of in vitro stimulation. (C) Table shows the median fluorescence intensity (MFI) of CD16 expression (mean ± SEM [n = 4]) at days 0, 1, 3, and 5. (D) Data show the percentage of CD16 expression on CD14++CD16− monocytes after 1, 3, and 5 days of stimulation with Th1 (TNFα, IFNγ), Th2 (IL-4, IL-13), or anti-inflammatory (IL-10, TGFβ) cytokines (gray bars) compared with CD16 expression acquired by classical monocytes without stimulation (black bars; control). Statistical analysis was performed via Student t test.

