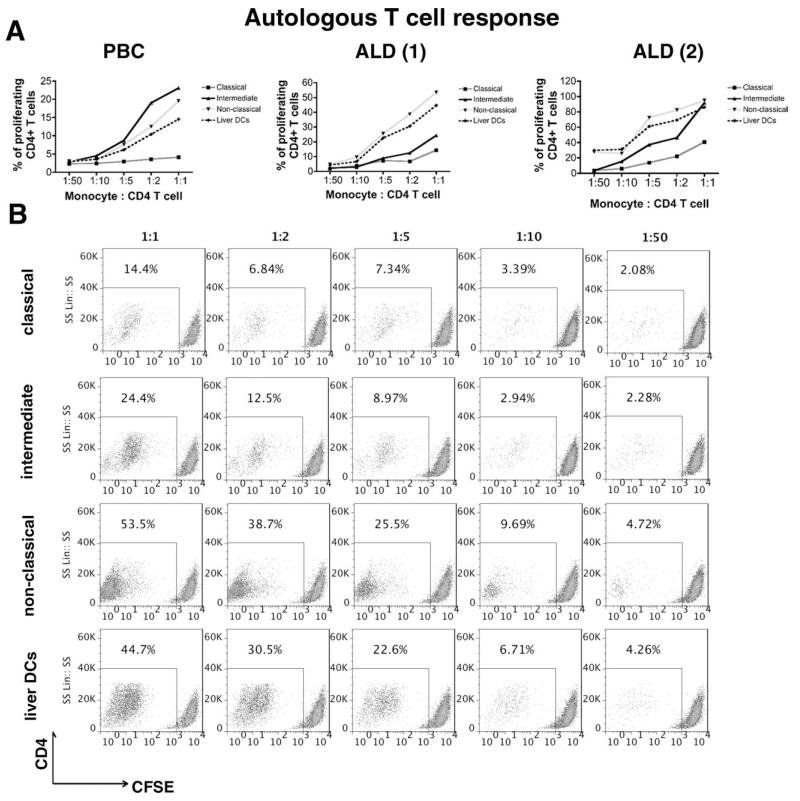
Fig. 7. Antigen presentation and T cell proliferation.
Classical, intermediate, and nonclassical monocytes and DCs isolated from three diseased human livers (ALD, n = 2; PBC, n = 1) by FACS were incubated with tuberculosis protein for 24 hours prior to coculturing with autologous CFSE-labeled CD4+ T cells for 4 days at 1:1, 1:2, 1:5, 1:10, and 1:50 ratios (monocyte/DC: CD4). (A) Percentage of proliferating CD4+ T cells at different coculture ratios in PBC and ALD livers. (B) Representative flow cytometry plots showing the T cell proliferation induced by the different monocyte subsets and liver DCs isolated from one of the two ALD livers. (1) and (2) represent the two different ALD livers tested.

